The S&P 500 PEG Ratio Is 0.68: Charts and Chat, October 25, 2026
The S&P 500's PEG ratio fell to 0.68 in October 2026, below its March 2009 reading of 0.86, even as rising margin debt and elevated equity allocations signalled potential market risks. The unusually low growth-adjusted valuation reflects expectations of stronger earnings growth, particularly from AI investment, while questions remain about when those productivity gains will materialise across the broader economy.
"We have to be eyes wide open to what's going on with a market that has really gone parabolic in some respects due to the AI craze," said Eric C. Boyce, CFA, President, CEO and Chief Investment Officer of Boyce & Associates Wealth Consulting, in the October 25, 2026 edition of Charts and Chat. His observation reflects the tension between optimistic earnings expectations and investor positioning, particularly as margin debt has reached levels that preceded previous market pullbacks.
Beyond equity valuations, weak housing activity, uneven productivity growth, tighter financial conditions, and rising household expenses add to the complexity of investment decisions. Together, these developments raise questions about portfolio concentration, long-term returns, and diversification as investors assess whether expected earnings growth can justify current market valuations.
Labor Holds Its Shape While Housing Does Not
The labor market reads as stasis rather than strength. Initial jobless claims, on both the four-week moving average and the weekly data, have trended down through the last 18 months, and continuing claims remain decidedly down despite a recent uptick. Boyce reads the two together as the U3 and U6 views of the same picture: "We just don't have a tremendous amount of job creation, necessarily, but we don't have a lot of job degradation as well."
Regional surveys agree. The Kansas City Fed composite index, a diffusion index where anything above zero signals expansion, has run positive for most of the year. New orders ticked down but stayed positive, and future expectations sit off their interim peak without weakening. Boyce treated that as "another one of those variables that seems to argue in favor of the expansion continuing."
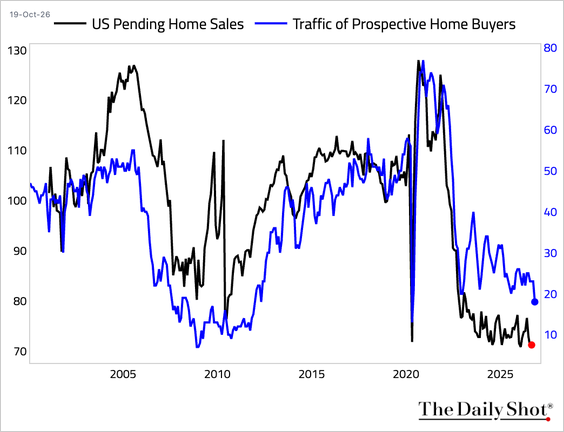
Housing is the exception, and not a marginal one. National Association of Home Builders sentiment is in the doldrums, pending home sales sit near the bottom of a multi-year range, and traffic of prospective buyers has collapsed to a fraction of its 2020 level.
Plotting the 30-year mortgage rate on an inverted basis against the NAHB survey shows why, and the Atlanta Fed home ownership affordability index sits near 68 against a reference level of 100. "It's not something that has happened overnight," Boyce said, "but it's something that clearly has not gotten any better with higher interest rates upon us."
Consumer sentiment completes the split. University of Michigan sentiment, with current conditions and expectations alongside, has trended down for a long stretch. Boyce tied it to the K-shaped economy: households spending out of investment cash flow feel fine, while "you have people here that are seeing their beef prices double, gas prices higher, and so on. They're not feeling so good."
The Productivity Payoff Has Not Arrived Yet
The expected productivity gains from AI investment remain central to the earnings growth assumptions supporting current market valuations.
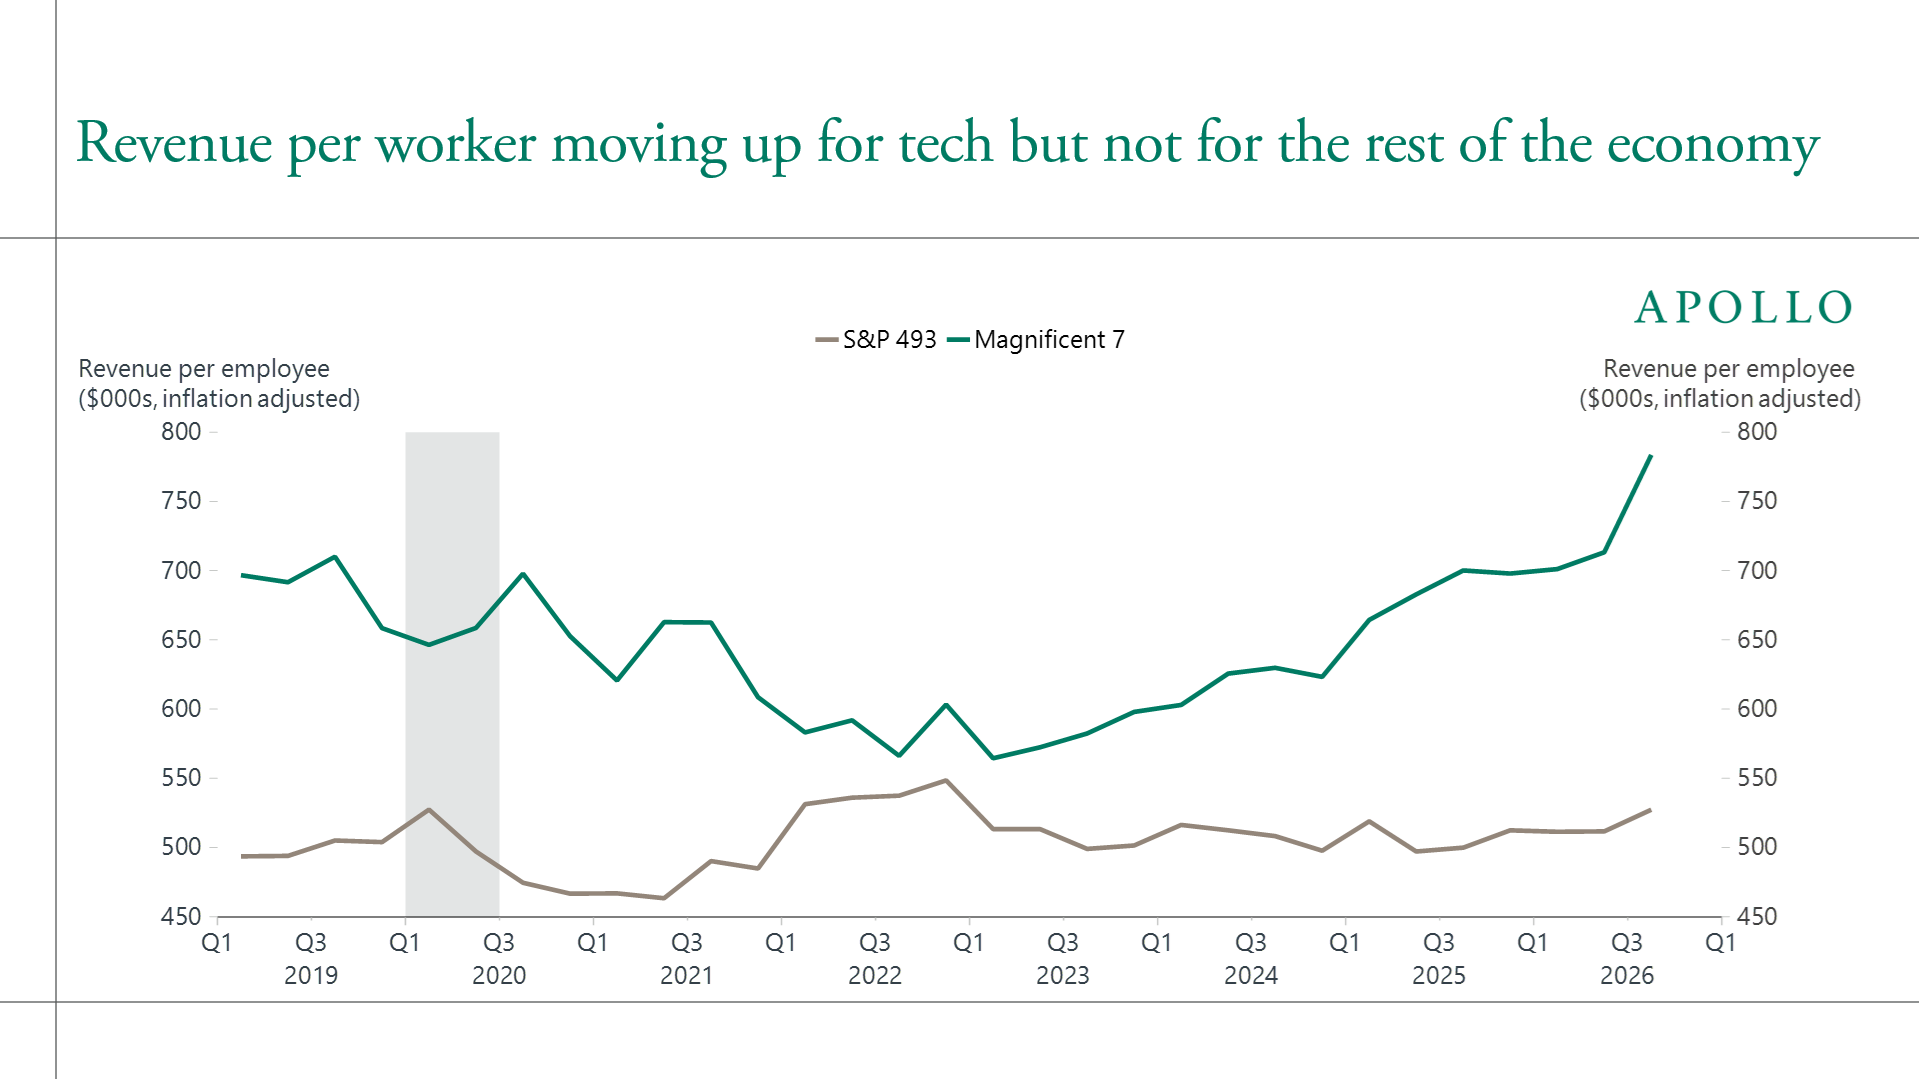
Revenue per employee has risen sharply for the Magnificent 7, from a low of roughly $565,000 in early 2023 to about $785,000 by the third quarter of 2026, inflation adjusted, well above the roughly $700,000 it held in 2019. The other 493 companies have moved from roughly $500,000 to about $525,000 over the same window.
A longer BofA series running back to 1986 shows S&P 500 revenue per worker stepping up through each technology transition, from PCs through the internet browser, mobile data and cloud services to the current big data and automation phase. The long record says the payoff eventually arrives. "That is the hope here," Boyce said, "and so this is S&P 500 revenue per worker, whereas this is kind of bifurcating the tech side of it."
Apollo's analysis, titled "No signs of AI boosting productivity growth," shows output per hour rising by approximately 2% year over year, while total factor productivity has slipped slightly below zero in the latest reading. The figures indicate that broader productivity improvements remain uneven. Boyce also noted the possibility that AI-related productivity gains may become more apparent in 2028 rather than 2027, describing the effect as "more of a 2028 phenomenon."
Margins tell the same story in the same shape. The Magnificent 7 reached roughly 30% by the third quarter of 2026 while the S&P 493 sat near 10%, where it has been for a decade.
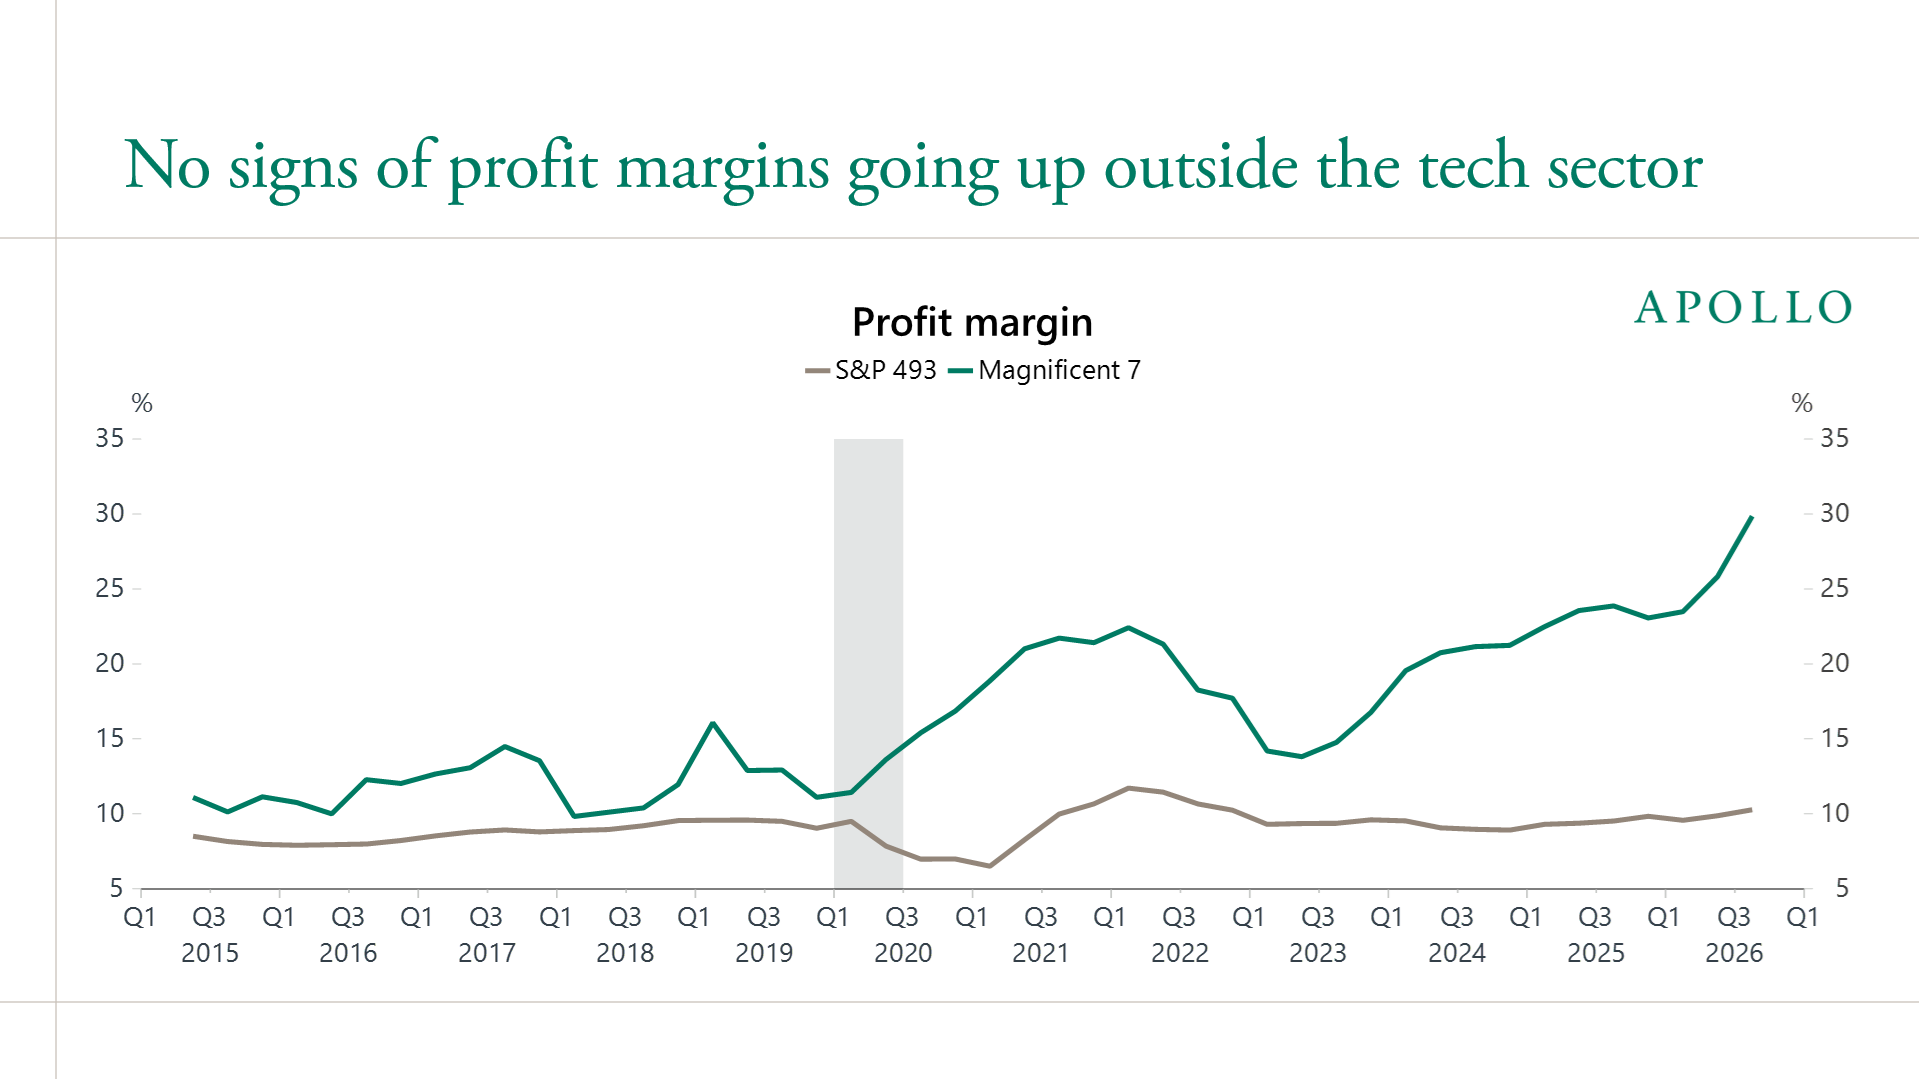
Boyce was careful not to read the flat line as deterioration. "Margins aren't going up, but they're not going down. They're steady," he said, and steady is not the same as bad: "if you have rising revenue but stable margins, your profits will go up." The acceleration sits in the Magnificent 7, and so does the margin expansion feeding the earnings expectations.
One survey cuts against the tightening narrative. Asked whether access to financing or its cost had constrained their investment or spending plans, 81% of firms said no against 19% who said yes. Boyce distinguished that from credit access, which has become harder at lower credit tiers, and reported the attitude of firms weighing productivity investments in their own voice: "I'll pay a higher rate because I know I'm going to get that higher productivity downstream."
Deal Value Holds Up Because the Deals Got Bigger
Global M&A transaction value is on pace for a fourth straight year of growth if the first three quarters' pace continues, which Apollo labels a near-record year. The split underneath it is stark: as of the third quarter of 2026, transaction value is up roughly 19% year over year while the number of deals is down about 8%.
Larger transactions are driving M&A activity even as the total number of deals decline. Boyce discussed how companies may turn to acquisitions when fewer internal projects meet their return expectations. However, he cautioned against drawing firm conclusions from declining deal volumes alone, noting that the trend "would certainly not argue for a late cycle type of economy." The rise in larger transactions, alongside fewer overall deals, offer a mixed picture of corporate investment activity.
Financial conditions are tightening on two independent readings. Morgan Stanley's index has tightened moderately since the September FOMC while staying only modestly restrictive, driven by the 10-year Treasury, the dollar, equities, oil and BBB credit spreads. A Goldman Sachs series puts the growth impulse from financial conditions near zero in the fourth quarter of 2026 and slightly negative across 2027. That feeds a view Boyce described rather than endorsed: without the productivity boost on schedule and with conditions tightening, 2027 could be weaker. His counterweight was historical. "When you're in the fifth year of an economic growth cycle, as you will be next year, you typically have a really good market, even if the economy isn't keeping quite the same pace."
Investors Are Leveraged and Heavily Allocated
Margin debt, measured year over year as a share of GDP, has spiked again. The chart marks the tech bubble, the global financial crisis and the pandemic, and in each case a spike preceded a pullback in the index below it.
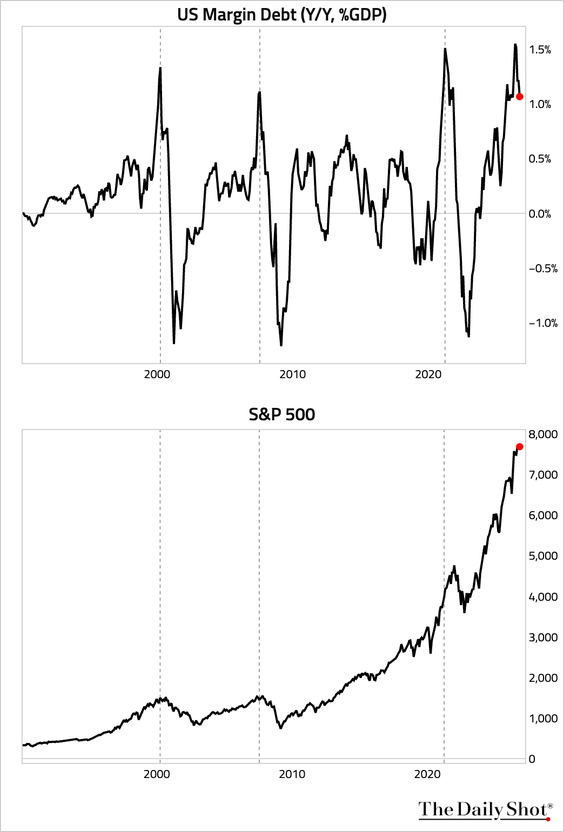
Boyce was explicit about the chart's limits. There have been false positives along the way, and he declined to forecast from it.
Private client equity allocation has climbed back to the level it reached at the 2021 peak.
| BofA private client equity holdings, % of AUM | Reading |
|---|---|
| February 2009 | 39% |
| March 2020 | 54% |
| September 2007 | 57% |
| Long-run average | ~57% |
| October 2023 | 58% |
| October 2021 | 66% |
| Latest | 66% |
Equity holdings as a share of disposable personal income have accelerated over the last two to three years on BCA Research data. Boyce drew the distinction between the two groups that matters: fund managers are institutional and "less prone to behavioral mistakes than individual investors," while the disposable-income measure captures households who "run the risk of introducing more volatility."
Against that, a JP Morgan study on timing. Average cumulative S&P 500 total returns from 1988 to 2025, comparing investment on any day against investment at a new high, favour the new-high entry at every horizon beyond six months: 14% against 12% at one year, 29% against 26% at two, 46% against 41% at three, and 82% against 76% at five. Only the three-month window favours the any-day entry, at 3% against 2%.
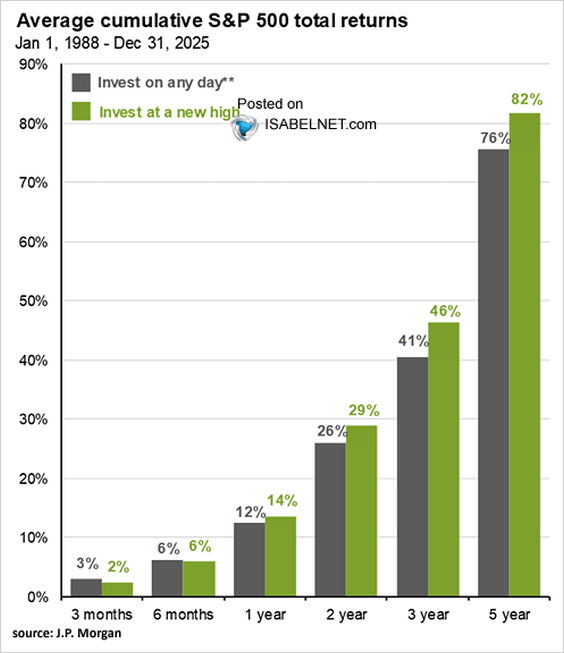
Boyce named the question this answers, because he fields it constantly. "The question I get all the time is, do you think we're at a top? Should we wait for a better time?" His reading of the chart was about cash rather than about selection: "exactly where you go with those dollars does matter," but holding cash while waiting for a better entry is the thing the data argues against.
What the War Did to Prices
Commodity prices rose sharply between February 28 and October 16, 2026, following the start of the Iran war, with significant increases across energy and agricultural products.
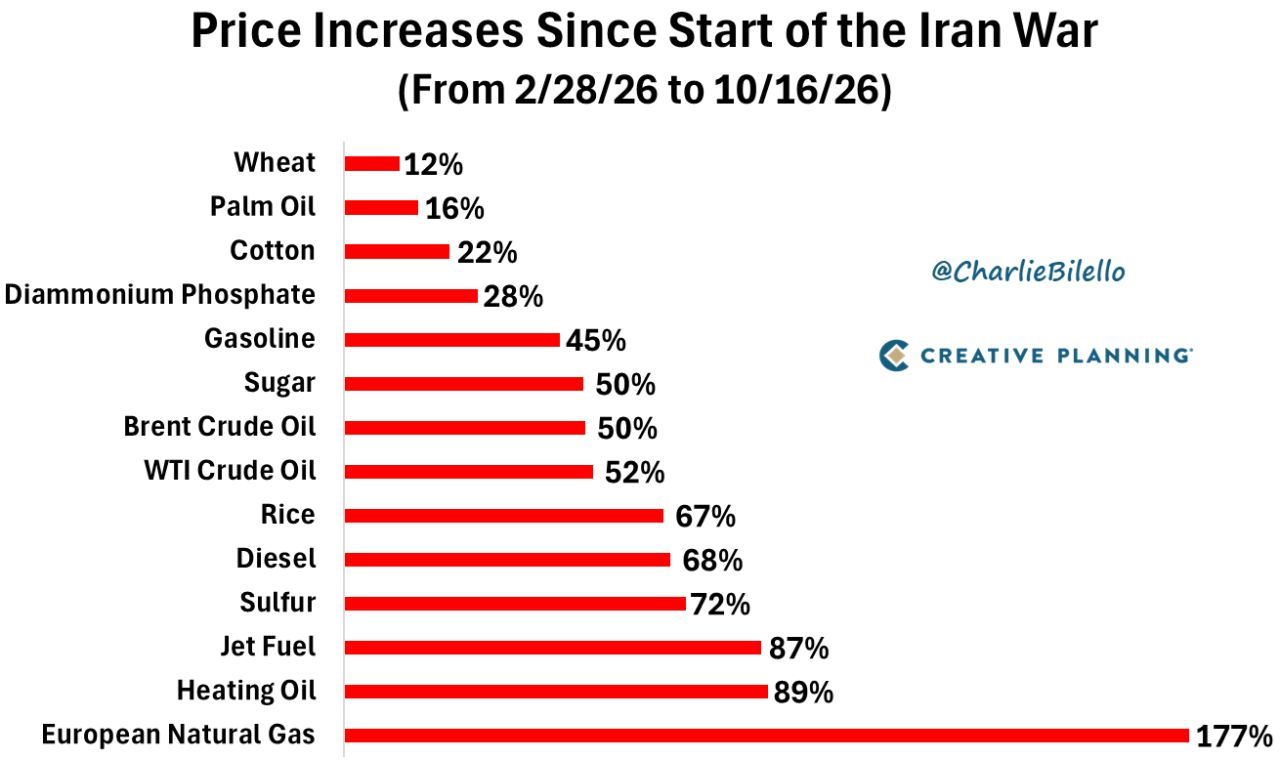
European natural gas leads at 177%, with heating oil at 89%, jet fuel at 87%, sulfur at 72%, diesel at 68% and rice at 67%. Gasoline is up 45%, cotton 22% and wheat 12%. Boyce traced the pass-through rather than listing the numbers: diesel moves freight, jet fuel moves airfares, and heating oil "will become a real big problem in some of the colder parts of the country here starting next month." His conditional is worth keeping. Had the conflict run the four to six weeks originally anticipated, "then this would all kind of prove transitory."
PIMCO's decomposition of core PCE into demand-driven and supply-driven inflation shows both spiking after the pandemic and both receding, usually moving together and occasionally diverging. The component Boyce found most interesting is the residual: a growing shaded area the analysis cannot attribute to either source. Large unexplained gaps are rare, and one is open now.
Industrial production ran the other way, which he flagged as hard data rather than sentiment. Total industrial production came in better than expected, and manufacturing production landed in line at 0.3% month over month against a 0.3% estimate, rising to 0.5% with motor vehicles stripped out.
On gasoline specifically, BloombergNEF estimates US drivers have already absorbed $83 billion in additional costs against the prewar benchmark, measured to the week ending 12 October. The scenarios diverge on when the Strait of Hormuz reopens: November 2026 puts the cumulative figure near $570 per vehicle, January 2027 near $830, and April 2027 near $1,210 and still climbing.
The Retirement Gap and the Entitlement Arithmetic
Since the fourth quarter of 2024, the S&P 500 has grown 27.5% cumulatively while the average 401(k) returned 18.3% and the average IRA 13.3%, on FactSet and Fidelity data through the second quarter of 2026.
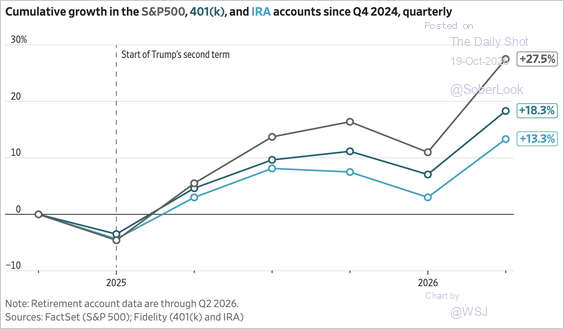
Boyce's reaction was that the gap should be wider than it is. "When I first saw this chart, I was surprised that the delta wasn't even greater," he said, before naming what it represents: "an opportunity cost that's being borne by would-be retirees." He attributed it to the two failure modes he sees in retirement accounts, overmanagement and inattention, which is the kind of gap financial planning review surfaces.
On entitlements, Brookings data on a typical average-income couple turning 65 in 2025 separates the two programs sharply.
| Lifetime value, average-income couple turning 65 in 2025 | Taxes paid in | Benefits received |
|---|---|---|
| Social Security | $824,000 | $874,000 |
| Medicare | $225,000 | $722,000 (net of premiums) |
Social Security benefits modestly exceed what the couple paid in. Medicare returns roughly three dollars for every dollar contributed. Boyce expects the asymmetry to drive the policy conversation: "I think this is a real deal that we are going to be talking about over the next five to 10 years."
Treasuries, Gold and a New Trillion-Dollar Holder
Foreign holdings of US Treasuries have reshuffled at the top. As of August 2026, the United Kingdom crossed a trillion dollars and now sits second behind Japan, while China's holdings have fallen to roughly half Japan's.
| Largest foreign holders of US Treasuries, August 2026 | Holdings |
|---|---|
| Japan | $1,068.28B |
| United Kingdom | $1,009.45B |
| China, Mainland | $590.73B |
| Belgium | $490.51B |
| Canada | $464.59B |
| Cayman Islands | $463.02B |
| Luxembourg | $448.23B |
| France | $363.40B |
| Ireland | $352.09B |
| Taiwan | $298.41B |
Boyce read the substitution as the story. China has been "disintermediating," he said: "They've been selling treasuries or they've been letting them run off and they've been replacing it with gold." The foreign buyer is "being replaced by UK and some of these other countries." He flagged the Cayman Islands entry as less surprising than it looks, given the finance routed through it.
Gold has come off its peak back to around $4,000 and silver below $60, which Boyce read as euphoria fading to something more defensible: "I think they're at levels that make a lot more sense." A Bloomberg and Goldman Sachs chart argues gold supply in the ground grows scarcer over time, and he drew the parallel to copper, where newly mined supply is decelerating.
Treasury yields sold off hard across the curve and have since retraced, with the 10-year back just below 5%. Boyce has previously named 6% as the level at which de-risking would pull money out of equities into Treasuries. "Well, that hasn't happened. And not to say that it will." He paired it with the reminder that drives the mechanics: "when rates go up, prices are going down and vice versa."
Valuation Says Something Different From Sentiment
Rolling 15-year S&P 500 returns, on a Ritholtz series running from 1941, read 15.7% in the October 25 pack. The series approaches zero only once, in the mid-1940s, for windows beginning in the Depression. Boyce offered his own floor rather than the chart's: "if you have a long-term horizon, I think the worst you should expect over a 15-year rolling period is maybe 5 percent."
Within equities, growth has taken a back seat and value has picked up leadership, which Boyce read as near-term skepticism about whether the hyperscalers can deliver the growth their earnings expectations assume. Globally, the proportion of markets trading above their 50-day moving average has fallen, so the turbulence is not a US-only phenomenon.
The S&P 500 PEG ratio compares the forward price-to-earnings ratio with expected five-year earnings growth, stood at 0.68 on October 17, 2026, well below its long-run average of 1.35 and the chart's reference level of 1.0.
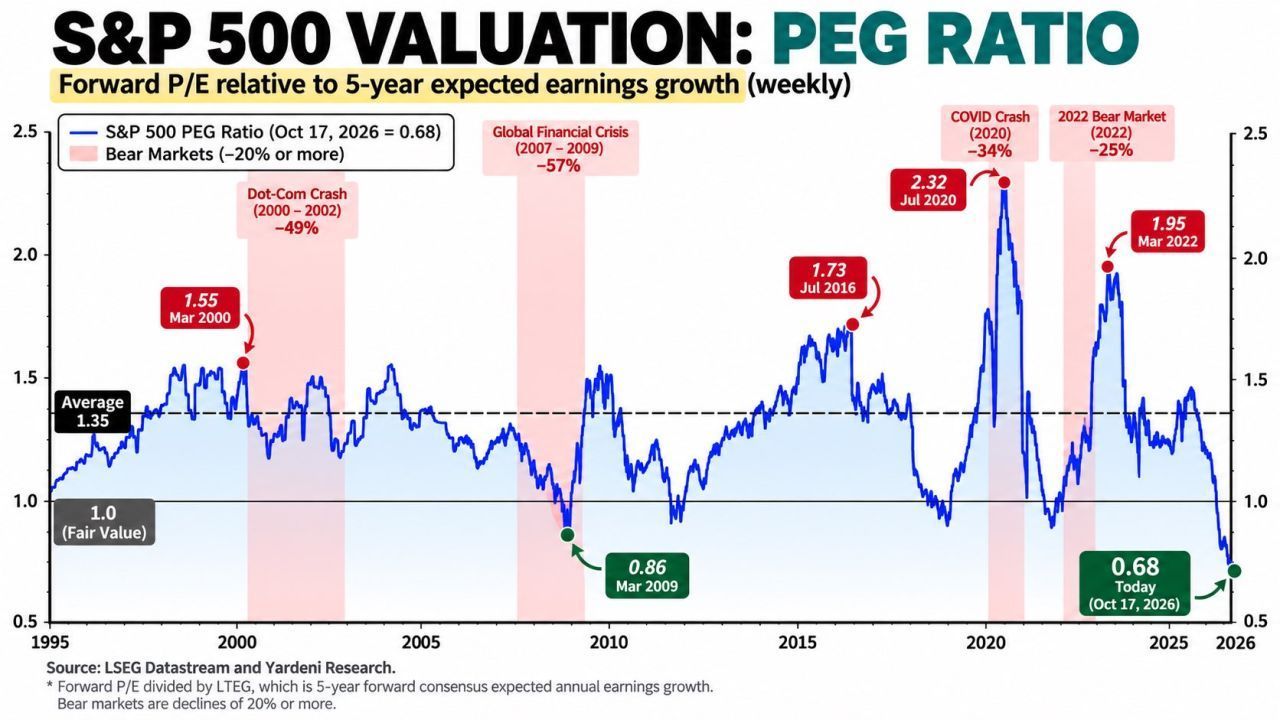
The labelled peaks run 1.55 in March 2000, 1.73 in July 2016, 2.32 in July 2020 and 1.95 in March 2022. The labelled trough before this one is 0.86 in March 2009. The current reading sits below it, and below anything else on a series beginning in 1995. The arithmetic behind it is not mysterious: multiples have come down because earnings have gone up, and the denominator carries high expected growth from the AI build-out.
Boyce linked the valuation outlook to the timing of AI-driven productivity gains, suggesting that the benefits may become more apparent in 2028 and beyond rather than in 2027. Given these expectations, he noted that current valuations could make a stronger case for remaining invested rather than withdrawing from the market. He also highlighted opportunities in value-oriented investments, companies with strong cash flow, and dividend growth, which investors can consider as part of an investment management review.
The pack closed on a cost that has nothing to do with markets. The average US family health insurance premium has risen from $5,809 in 1999 to $28,303 in 2026, an increase of 387%.
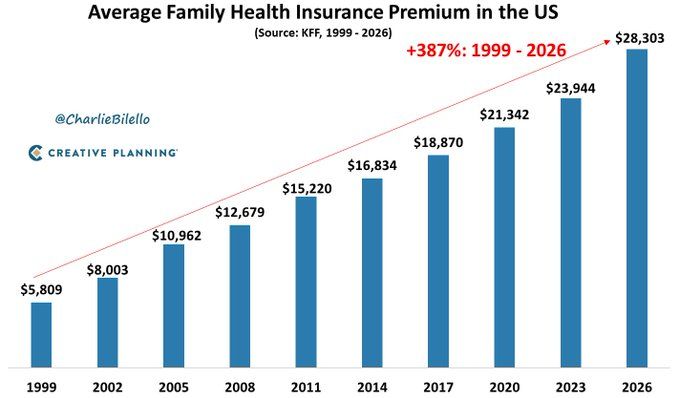
"Every year it has gone up," Boyce said, noting that the rate has outpaced general inflation consistently. He placed it back inside the K-shaped frame the week kept returning to, as a contribution to the total cost of living that households feel whether or not their portfolios are rising.
What the Week's Data Changes
Market concentration, uncertain productivity gains, and rising household expenses have implications for portfolio allocation, diversification, and long-term financial planning.
- AI productivity and earnings expectations: Earnings expectations across the index assume productivity gains that have so far been concentrated in the Magnificent 7's revenue per worker and margins. If those gains broaden, the PEG reading of 0.68 could signal opportunity. If they arrive in 2028 rather than 2027, tighter financial conditions could weigh on the intervening year.
- Market positioning and valuation: Margin debt has spiked to levels that preceded the last three market pullbacks, while private client equity allocation matches its 2021 peak. At the same time, growth-adjusted valuation is at its lowest level in a thirty-year series. These conflicting signals make it important to examine individual portfolio holdings and their exposure to market risks.
- Household costs and financial planning: Fuel prices have risen 45% to 89%, depending on the product, while average family health insurance premiums have reached $28,303. Retirement-account returns have also lagged the S&P 500 since Q4 2024. These developments affect spending and savings assumptions, making them relevant considerations in an ongoing wealth management review.
Market conditions can change how investors approach diversification, retirement planning, and long-term financial goals. Boyce & Associates helps clients assess portfolio risks, review investment allocations, and account for changing financial needs through its wealth management services. Connect with the team to discuss how these considerations fit into your financial plan.
FAQ
Does a PEG ratio of 0.68 mean the market is cheap?
A PEG ratio of 0.68 suggests the S&P 500 is relatively inexpensive compared with its expected five-year earnings growth as of mid-October 2026. The low reading reflects falling valuation multiples and rising growth expectations. However, its interpretation depends on whether those earnings forecasts materialise, particularly the anticipated productivity gains from AI investment.
Why does margin debt matter if it has given false signals before?
Because the pattern has been directionally useful without being reliable enough to trade on. Spikes in margin debt as a share of GDP preceded the tech bubble, the global financial crisis and the pandemic pullbacks, and there have also been spikes that resolved into nothing. Boyce treated the current reading as a reason for attention rather than action, and explicitly declined to forecast from it.
Is it worse to invest when the market is at a high?
The JP Morgan data covering 1988 to 2025 says the opposite at every horizon beyond six months. Investing at a new high returned 14% at one year against 12% for any-day entry, and 82% at five years against 76%. Only the three-month window favoured any-day entry. The comparison is between investing and holding cash, not between one security and another.
Why have retirement accounts lagged the index so badly?
The gap since the fourth quarter of 2024 is 27.5% for the S&P 500 against 18.3% for the average 401(k) and 13.3% for the average IRA. Retirement accounts hold bonds and cash alongside equities, so some gap is structural rather than a mistake. Boyce attributed the rest to the two behaviours he sees most, overmanaging the account or ignoring it entirely, and said he expected the difference to be larger than it is.
Want the Full Chart Pack?
Watch the October 25, 2026 edition of Boyce & Associates Charts and Chat for the complete walkthrough, including the PIMCO decomposition of unexplained inflation and the detail on gold, silver and copper supply that this summary covers only briefly.
This article is derived from the October 25, 2026 edition of Boyce & Associates Wealth Consulting's Charts and Chat commentary. Insights and quotes are attributed to Eric Boyce as they appeared in that commentary. Charts are reproduced from the accompanying slide deck and were credited there to The Daily Shot, Apollo Academy, Charlie Bilello and Creative Planning, BofA Global Research and BofA Global Investment Strategy, J.P. Morgan, PIMCO, BCA Research, Brookings and the Urban Institute, Arbor Data Science, BloombergNEF, Ritholtz, LSEG Datastream and Yardeni Research, Goldman Sachs, Morgan Stanley, First Trust Portfolios, Sandy Leeds of the University of Texas at Austin, BlackRock, the St. Louis Federal Reserve, the Wall Street Journal and Bloomberg. The piece does not separately cite external sources beyond the commentary itself; for primary data on employment, prices and national accounts, refer to the Bureau of Labor Statistics, the Bureau of Economic Analysis, the Federal Reserve and the US Treasury.
Investment advisory services offered through Boyce & Associates Wealth Consulting, Inc., a registered investment adviser. The views expressed are those of the speaker as of October 25, 2026 and are subject to change. Forward-looking statements and estimates are based on sources believed to be reliable but are not assured as to accuracy. Past performance is not indicative of future results, and all investments carry risk of loss. Nothing here constitutes legal or tax advice; please consult the appropriate professional regarding your individual circumstances.