The Fed Would Need 7% to Hit 2%: Charts and Chat, Nov 8, 2026
Apollo's economic model suggests the Federal Reserve would need to raise the federal funds rate to approximately 6.75% to bring CPI inflation back to 2%, compared with roughly 3.8% in the second quarter of 2026. Consumer prices also remain 14% above where they would have been had inflation followed a steady 2% annual path since January 2020. The findings highlight the challenges of controlling inflation without putting additional pressure on economic growth.
"The Fed has not done a good job of trying to manage that 2%," said Eric C. Boyce, CFA, President, CEO and Chief Investment Officer of Boyce & Associates Wealth Consulting, during the November 8, 2026 edition of Charts and Chat. Discussing the potential impact of higher interest rates, he added, "That's the type of thing that sends economies into recessions, but that's what would have to happen if we still felt like that 2% target was viable."
The post-election market selloff, technology-sector weakness, rising housing costs, and changing credit conditions add to the economic uncertainty. These developments also raise questions about market concentration, portfolio diversification, and how investors should assess risk as financial conditions change.
Market Cap Gave Back More Than Half the Year's Gain
Apollo's running tally of the change in US equity market capitalization since January 1, 2026 peaked above $11 trillion in early October. The final reading on the chart, drawn in the week of the election, is close to $5.5 trillion.
Boyce put the peak at "probably close to $10 trillion" and described the drawdown in approximate terms, "$2, $3, $4 trillion worth of market cap with the selloff and a lot of those key technology names." He read the shape of the week as ordinary. "We had a rally in the day after the election, which is actually not atypical, but then we saw a rather dramatic selloff, and then some kind of like bottom fishing."
On the election itself he stayed with the mechanics. A legislature at odds with the executive branch usually produces what he called "a stasis of policy initiatives," and he noted that "generally, markets tend to perform a little bit better when you do have kind of a divided government."
One chart found a benefit in all of it. PIMCO's estimate, built on Bureau of Economic Analysis data through September 2026, puts the contribution of professional advocacy spending to real consumption growth at roughly half a percentage point for the year, with the average election-year impulse stepping up after 2019 to around 0.44 points. "Being the highly contentious midterm election that this was, we actually did get a tangible benefit to economic growth from all that spending."
What Getting Back to 2% Would Actually Cost
Persistent inflation, rising business costs, and the potential need for higher interest rates highlight the challenges facing the Federal Reserve as it works to bring inflation back toward its target.
Mentions of inflation and its synonyms on S&P 500 post-earnings conference calls are accelerating. The Daily Shot's chart, extrapolating the third quarter of 2026 from 691 mentions counted as of October 30, projects a year-over-year increase above 60%, the steepest since mid-2022. Boyce separated the two inflations behind the number: consumer-facing prices, and the cost structure inside the businesses themselves. He tied the acceleration to fuel. "Now that we've got persistently high fuel costs like diesel that have not necessarily come down as much, that that is now flowing through to the overall cost structure."
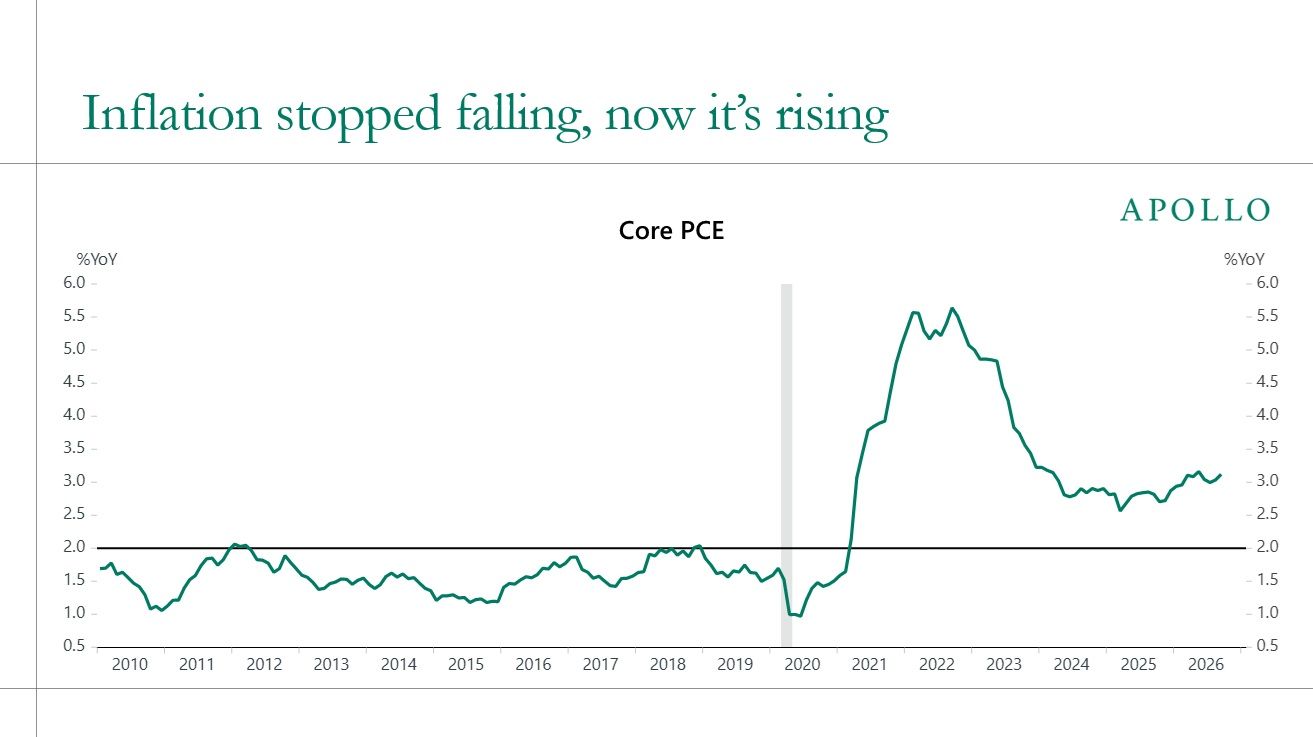
Charlie Bilello's chart of actual CPI against a 2% trend line from January 2020 shows the index at 336.3 in September 2026 against 296.0 on trend, a gap of 14%. Realized inflation over that stretch annualized at 4.0%, double the target. Core PCE, the measure the Fed weights most heavily, printed 3.1% year over year in September 2026 and has now spent 67 consecutive months above 2%, down from a 5.6% peak in early 2022 but no longer falling.
Apollo's model answers the question those three raise. To bring CPI back to 2%, the fed funds rate would have to climb from roughly 3.8% in the second quarter of 2026 to about 6.75%, with CPI reaching the target only at the far end of the projection.
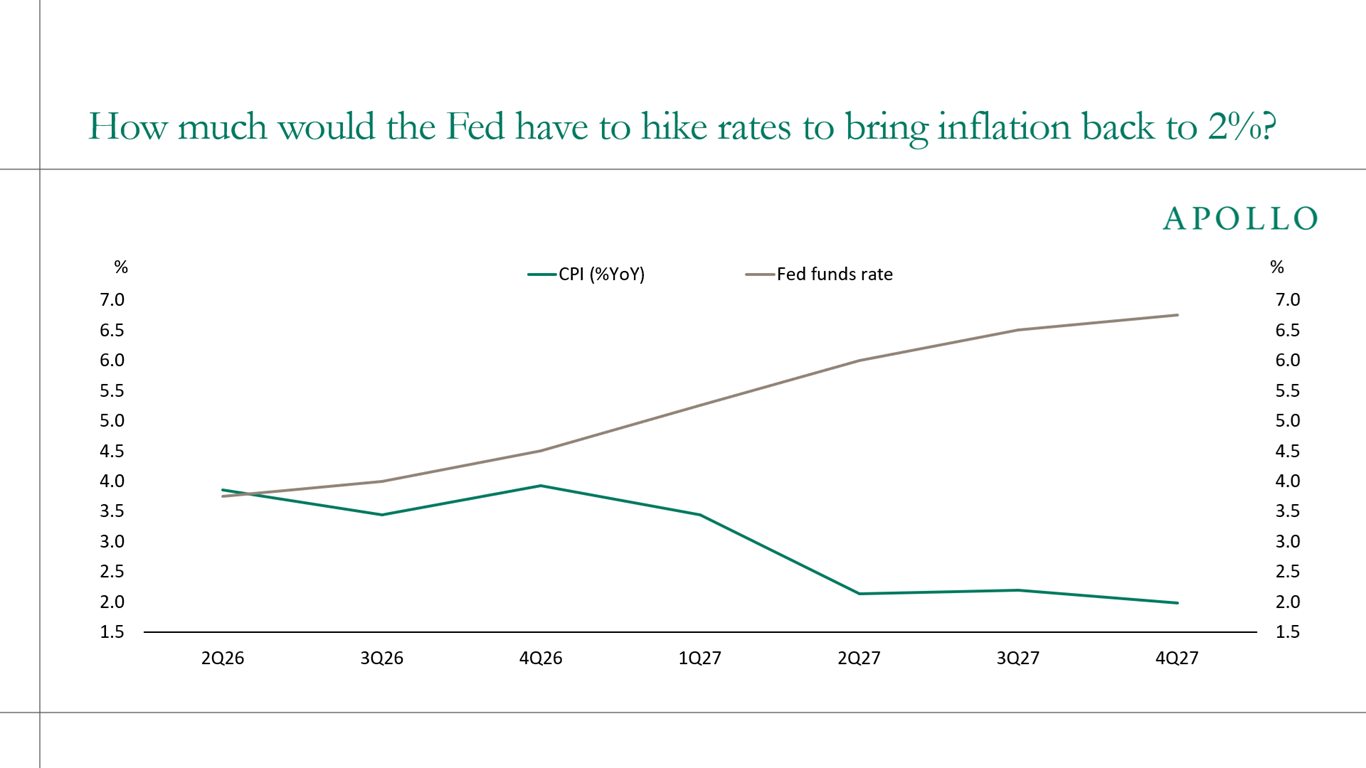
Boyce's conclusion was that the target itself has stopped being useful. "I think really what we should be thinking about now is that that target is just simply not valid."
Prices Up 31.3%, Wages Up 25.9%, and a Housing Index at 29
Consumer prices have gained 31.3% since the start of 2020. Average hourly earnings have gained 25.9% over the same period. The gap of 5.4 percentage points has persisted for years, and Boyce connected it directly to the vote
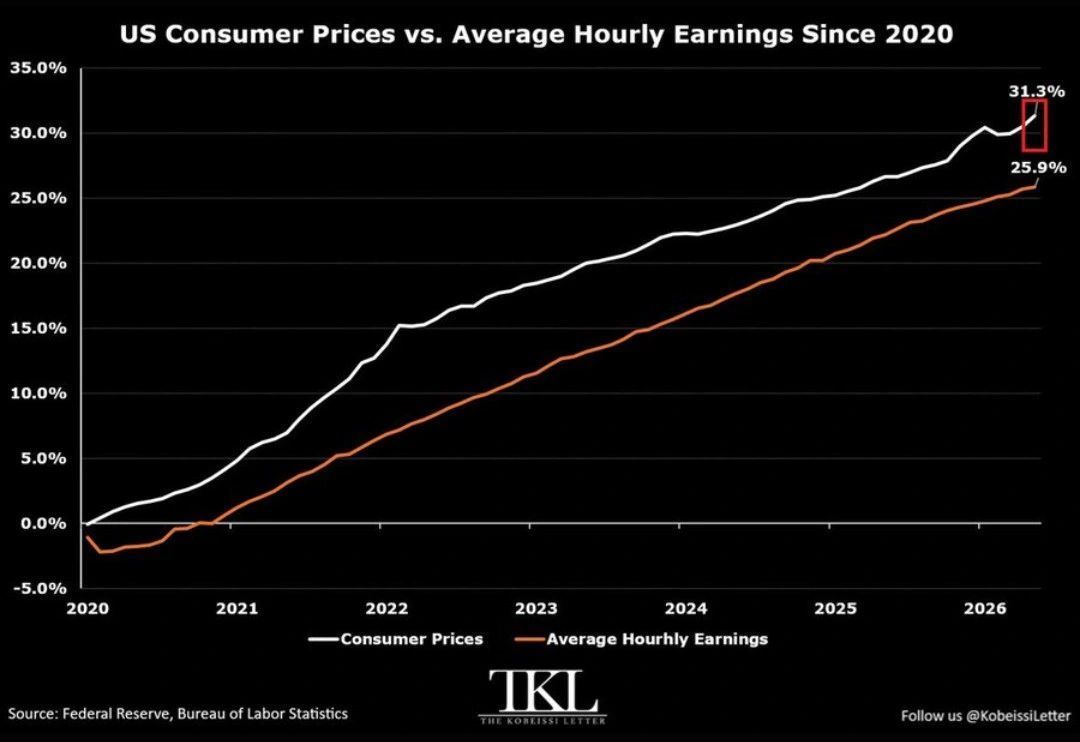
He also marked it down as a forecast he got wrong on timing. "I can say, you know, with a fair degree of, you know, crow being eaten here that I thought that this would have a greater impact on us sooner." His explanation for why it took so long depends on who is spending out of what. Households spending a dollar of income as it arrives feel the gap immediately. Households spending partly out of investment earnings do not. "The difference of opinion is great, and this, I think, does speak to some of what happened in the election, that we have had this divergence for some time, and people at the lower and middle income cohorts are just flat mad about it."
Housing is the second cost that showed up at the polls. The NAHB/Wells Fargo Housing Market Index printed 29.00 in the October 19, 2026 reading, its lowest since 2012. The MBA 30-year mortgage rate stood at 7.30% as of November 4, 2026, while the effective rate on mortgages already outstanding has crept up to roughly 4.3%. Boyce's point was about the threshold rather than the level. A long-run average near 6% or 6.5% is defensible, he argued, and the pain is partly a hangover from a decade of cheap money. Past 7% is different. "When you punch through 7 and get close to 7.5, particularly if you get close to 8, that is what's contributing to this housing market that is in a real, real funk right now." He expects the second-derivative spending to follow the turnover down: renovations, home improvement retail, everything that follows a sale.
The Hard Data Stayed Strong While the Forecasts Softened
Recent manufacturing, services, factory orders, and retail activity data indicate continued economic expansion, despite concerns about inflation and household costs. Boyce noted that these readings presented a stronger picture of economic activity than the cost-related indicators suggested.
| Reading, October or September 2026 | Actual | Estimate |
|---|---|---|
| ISM Services PMI (Oct) | 54.5 | 54.8 |
| ISM Services New Orders (Oct) | ~55.8 | n/a |
| ISM Manufacturing PMI (Oct) | 55.5 | 54.6 |
| S&P Global US Manufacturing PMI (Oct) | 54.9 | 56.0 |
| S&P Global US Services PMI (Oct) | 56.1 | 57.9 |
| US Factory Orders, month over month (Sep) | +1.8% | +1.2% |
| US Core Capital Goods Orders, month over month (Sep) | +0.6% | n/a |
| Redbook same-store sales, year over year | +10.4% | n/a |
He rates services as the more important half of the ISM pair, "because we are a service-based economy now," and read the combined S&P Global picture as a trend "upward and to the right." He caught himself mid-sentence: "anything that gets up close to 60 represents extremely robust conditions, which we are certainly not there, but the environment is actually very, I'd say, very, very, that's a strong word, but relatively strong."
Retail sales were the reading that surprised him most. Negative real income growth should have shown up there and has not. "We do know that people are spending out of savings. We do know that people are spending on credit cards and things like that. But this number still is very, very healthy."
Against all of that, the forward-looking survey pointed the other way. The Daily Shot polls its subscriber base, and Boyce noted he contributes to it himself. Between September and October 2026, the share expecting weaker global growth over the next twelve months rose to close to half, while the share expecting stronger growth slipped. Expectations for core inflation softened over the same month, with fewer respondents looking for higher inflation and more for lower. He drew the distinction carefully. "This is not what's necessarily happening in real time. This is just what people feel like the environment is going to look like 12 months down the road."
Data Center Construction Passed General Office
The clearest chart in the pack puts two construction series side by side. Spending on general office has drifted down from levels near $70 billion in the early 2020s toward $47 billion annualized. Data center spending, flat and small for a decade, has gone vertical and now prints close to $100 billion.
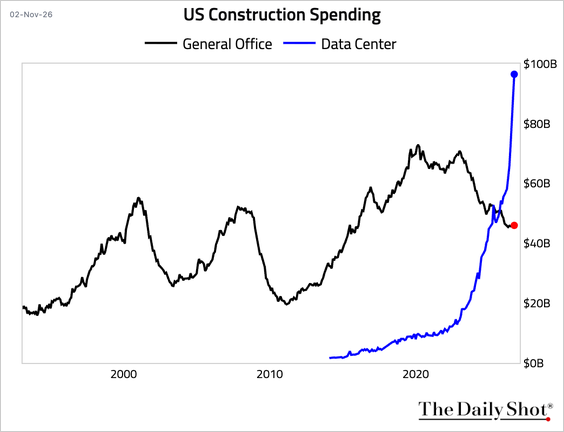
Boyce's description was short. Data centers have "really gone parabolic. And that's really the only thing you can say about it."
The companion chart on the same slide shows private residential construction rolling over from roughly $900 billion toward $840 billion while nonresidential turns back up near $800 billion. He attributed the residential decline to overbuilding in an easy-credit era across single family and multifamily alike, and the office decline to an absorption phase that has not finished.
What made the data center chart an election story is the local politics attached to it. Capital went in fast, Boyce argued, with little regard for the cost of funds and little coordination with the communities absorbing the construction. "That's why people got upset and wanted moratoriums on this. And I think the mandate that comes out of the elections is that that's going to be the case." His forecast from there is cost and delay. "It's going to be more expensive to build data centers and it's going to take longer to build data centers." He linked part of the week's selloff to exactly that repricing.
Technology Broke Its 200-Day and Everything Else Caught a Bid
The S&P 500 technology sector relative to the index closed the week at 0.84, down 3.27%, below a 200-day moving average near 0.87. Boyce treated the break as a technical signal rather than a valuation one. "It actually was strong enough to punch right through its 200-day moving average, which, from a technical analysis standpoint, is not favorable. You tend to, once you punch through that 200-day moving average, that you tend to stay there for a little while."
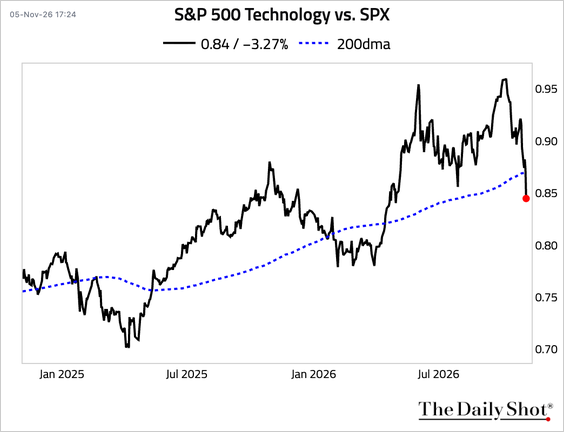
Every other factor reading is the same trade from a different seat.
| Factor reading, week ended 5 November 2026 | Level | Weekly change |
|---|---|---|
| S&P 500 Technology vs SPX | 0.84 | −3.27% |
| US Momentum (MTUM) | 62.60 | −8.24% |
| S&P 500 Equal Weight vs Cap Weight | 1.19 | +1.27% |
| S&P 500 Consumer Staples vs SPX | 0.14 | +3.60% |
| US Value vs Growth Factor | 2.34 | +4.05% |
| Tech Risk Appetite Indicator (composite) | 99.1 | n/a |
Jim Paulsen's analysis of the rolling three-month correlation between new-era stocks (technology and communication services) and old-era stocks (the rest of the index) shows the relationship falling to zero and slightly below in late 2026. These were the only negative readings in the series since it began in 2015. Boyce noted that higher volatility within the index can coincide with diversification benefits between the two groups "because of that negative correlation."
He also declined to call the rotation a problem. "I think it's healthy, too, because, you know, technology stocks got ahead of themselves. Granted, you know, the earnings expectations are really high and the valuation multiples have actually come down. But the overall volatility needed to be reconciled with the rest of the market."
Retail Bought 22 Sessions Straight Into the Selloff
Citadel Securities counts every retail net-buy run since 2017. The streak as of November 3, 2026 reached 22 consecutive sessions. Five earlier runs in the series were longer, the longest 32 sessions in early 2021.
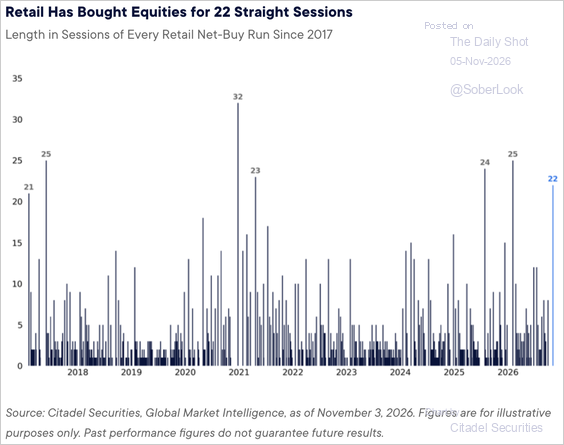
dataset, measured to October 30, 2026. Boyce's concern is not the buying but what it does on the way out. "This is the type of investment that is not sticky. So when retail investors begin, you see people start to head toward the exit doors that you could see kind of a mass exodus very quickly."
VIX closed at 28.18, up 11.6 points on the day, a level Boyce noted "has provided some really good pricing for structured investments." The more unusual number is underneath the index. Over the month to November 6, 2026, the S&P 500 itself moved 1.1% in absolute terms while the average stock in it moved 13.2%. The 12.1-point spread ranks in the 100th percentile over the past 30 years.
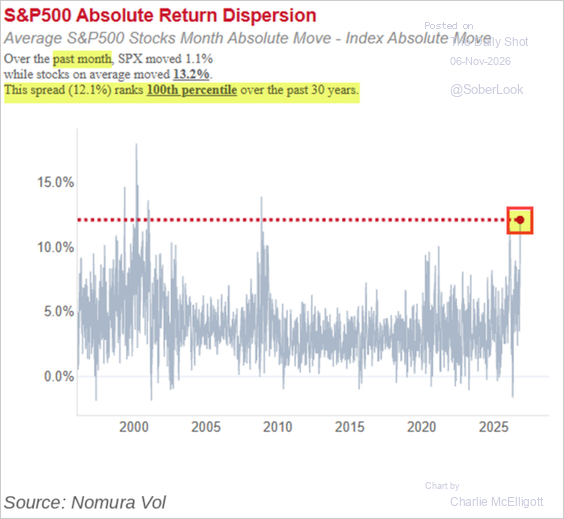
Boyce reached for the two comparisons the chart invites. "You've got to go back to 2008, the global financial crisis. And you've got to go back to the tech bubble bursting to find levels of intra-index dispersion being this high."
The breadth reading on the next chart shows the same split from the other side: 46.8% of S&P 500 constituents scored as overbought against 16.8% oversold, with the index's own 50-day spread stretched beyond two standard deviations. Boyce cautioned that the series goes back only a year, then named what he will watch instead: whether the market produces "broader participation and more unified participation after the election." He added that he does not have the answer yet.
Triple-C Spreads Blew Out While Energy Inventories Drained
Credit split by rating rather than selling off as a block. The spread between CCC and single-B rated US issuers reached about 1,000 basis points, the widest in the series since 2021 and a near-vertical climb from roughly 650 in mid-2026.
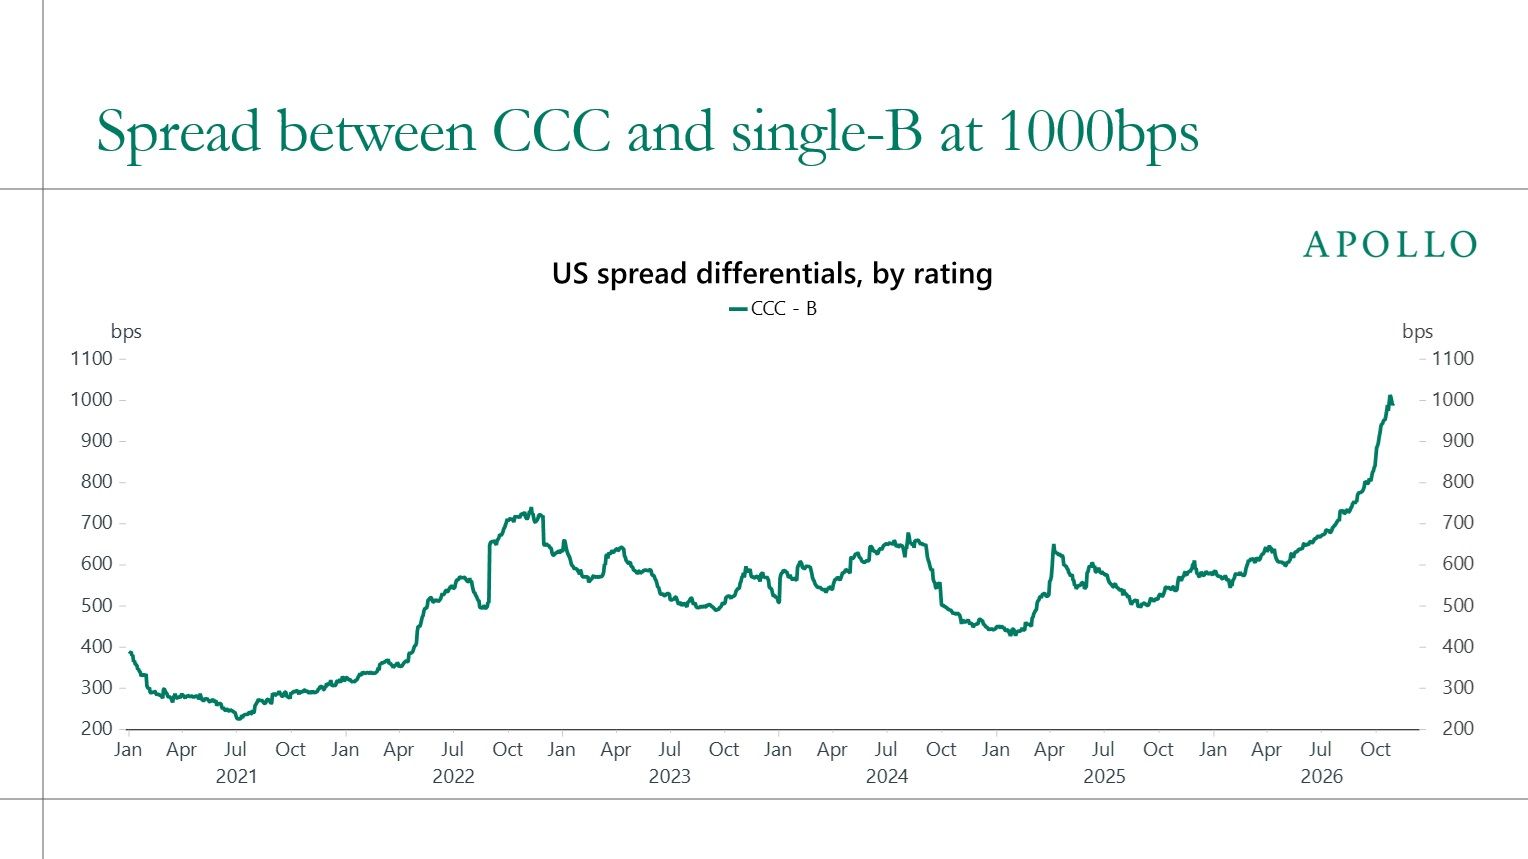
Boyce separated the two halves of that market. Single-B issuers "have actually held up pretty well." The widening is concentrated in issuers closest to default, and he read it as "a decreasing level of confidence in the credit markets, particularly in the low credit areas."
Schwab's study of the Bloomberg US Intermediate Corporate Bond Index from February 1996 to October 2026 sets the counterweight. Periods beginning with a yield to worst at or above 5.5% were followed by an average 7.5% total return over the next twelve months, against 4.8% across all periods. Boyce walked the mechanism rather than the headline: high yields accompany strong growth, growth eventually slows, slower growth brings easier credit and lower rates, and falling yields lift bond prices on top of the income. The chart's own note records that past performance is no guarantee of future results.
Energy inventories were the last economic read. US crude oil stocks are below their five-year range, gasoline stocks are at the low end of theirs, and distillate stocks are well below. The Strategic Petroleum Reserve has drawn down to roughly 283 million barrels, which Boyce placed at "levels we haven't seen since 1982." He attached the obvious caveat about why the number is hard to forecast from here. "We don't know how the administration is going to tackle the Iran situation."
US natural gas is the exception. Front-month US futures have stayed close to $3 per million BTU through 2026, apart from a brief January spike. European front-month futures have climbed to around $30, roughly ten times the US price.
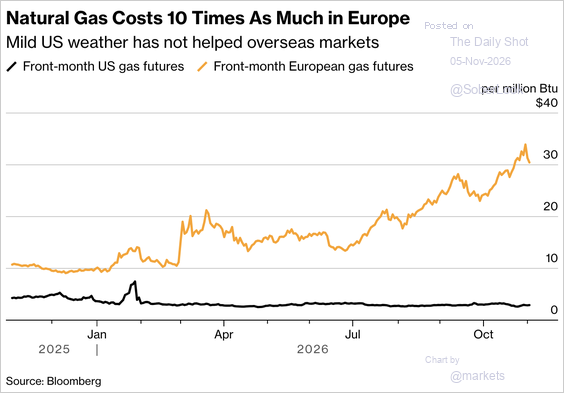
Boyce explained the divergence by how the two fuels are sourced. Natural gas is regional, crude is global and exposed to geopolitics. European prices have roughly tripled since January 2025, which he called "a big deal heading into the winter months" and a political problem in its own right.
What It Means for Portfolios This Week
Market volatility, household costs, and changing investment opportunities have important implications for portfolio management and long-term financial planning.
- Market volatility and diversification: The 12.1 point dispersion spread highlights how individual stocks can experience substantial price movements even when the overall index appears relatively stable. Boyce viewed the rotation between technology and other sectors as potentially reducing concentration risk through lower correlation between market segments. These shifts are important considerations for investment management.
- Household costs and financial planning: Consumer prices have risen 5.4 percentage points more than average hourly earnings since 2020, while mortgage rates have reached 7.30%. These pressures can affect household cash flow, savings, and long-term financial planning assumptions.
- Private markets and portfolio allocation: Goldman Sachs Global Investment Research, using Preqin data as of March 2026, estimates global private-market assets under management at $17 trillion across natural resources, infrastructure, private credit, real estate, and private equity. Boyce identified expansion into private markets as a priority for 2027, citing the potential for "excess return and also meaningful diversification for our client portfolios." Such investments require individual suitability assessments, including liquidity needs and investment risks, as part of a broader wealth management strategy.
Boyce did not make a forecast for the remainder of 2026. He identified broader market participation following the election as an important indicator to monitor, while acknowledging that the outcome remains uncertain.
FAQ
Why does Apollo's chart say the Fed would need a 6.75% rate to reach 2% inflation?
Apollo's model estimates about bringing CPI inflation down to 2% would require the federal funds rate to rise from approximately 3.8% in the second quarter of 2026 to 6.75%. This is a hypothetical scenario, not a Federal Reserve forecast. Boyce described the implied rate path as "extremely implausible" and questioned the practicality of the inflation target.
What does 67 consecutive months of core PCE above 2% actually tell you?
It separates a spike from a regime. Core PCE peaked at 5.6% in early 2022 and fell to 2.6% by early 2025, which looked like the end of the episode. It then turned back up and printed 3.1% in September 2026. A 67-month stretch above target covers the spike, the disinflation and the reacceleration, which is why Boyce argued the figure is no longer a transitory overshoot to be waited out.
Does a technology sector breaking its 200-day moving average mean the selloff continues?
Not necessarily. Breaking below the 200-day moving average is generally considered an unfavorable technical signal, but it does not guarantee further losses. Boyce noted that the ratio may remain below the average for some time. During the same week, equal-weight stocks, consumer staples, and value gained while momentum declined 8.24%, indicating a rotation across market segments.
Why is retail buying for 22 straight sessions treated as a risk rather than support?
Because of how the flow behaves in reverse. Boyce's argument is that retail positioning is less sticky than institutional positioning, more prone to herd behavior and faster to exit. A long accumulation streak is therefore a measure of how much flow could reverse quickly, not a measure of conviction. The data runs only to November 3, 2026, before the worst of the week.
Want the Full Chart Pack?
Watch the November 8, 2026 edition of Boyce & Associates Charts and Chat for the complete walkthrough, including the Apollo chart on unemployment below 5%, now at 61 months and closing on the 64-month record set between 1965 and 1970.
This article is derived from the November 8, 2026 edition of Boyce & Associates Wealth Consulting's Charts and Chat commentary. Insights and quotes are attributed to Eric Boyce as they appeared in that commentary. Charts are reproduced from the accompanying slide deck and were credited there to The Daily Shot, Sandy Leeds at the University of Texas at Austin Department of Finance, Torsten Slok at Apollo Academy, First Trust Portfolios, BlackRock, the St. Louis Federal Reserve, Wall Street Journal Markets and Bloomberg, except where individually noted. The piece does not separately cite external sources beyond the commentary itself; for primary data on employment, prices and national accounts, refer to the Bureau of Labor Statistics, the Bureau of Economic Analysis, the Federal Reserve and the US Treasury.
Investment advisory services offered through Boyce & Associates Wealth Consulting, Inc., a registered investment adviser. The views expressed are those of the speaker as of November 8, 2026 and are subject to change. Forward-looking statements and estimates are based on sources believed to be reliable but are not assured as to accuracy. Past performance is not indicative of future results, and all investments carry risk of loss. Nothing here constitutes legal or tax advice; please consult the appropriate professional regarding your individual circumstances.